Analyze health data without code, even across institutions
COMPASS covers the whole study in your browser, from cohort building to statistics, genetics and machine learning.
With federated analysis, patient-level records stay with each data holder. Only aggregate results come back.
One platform for the whole study
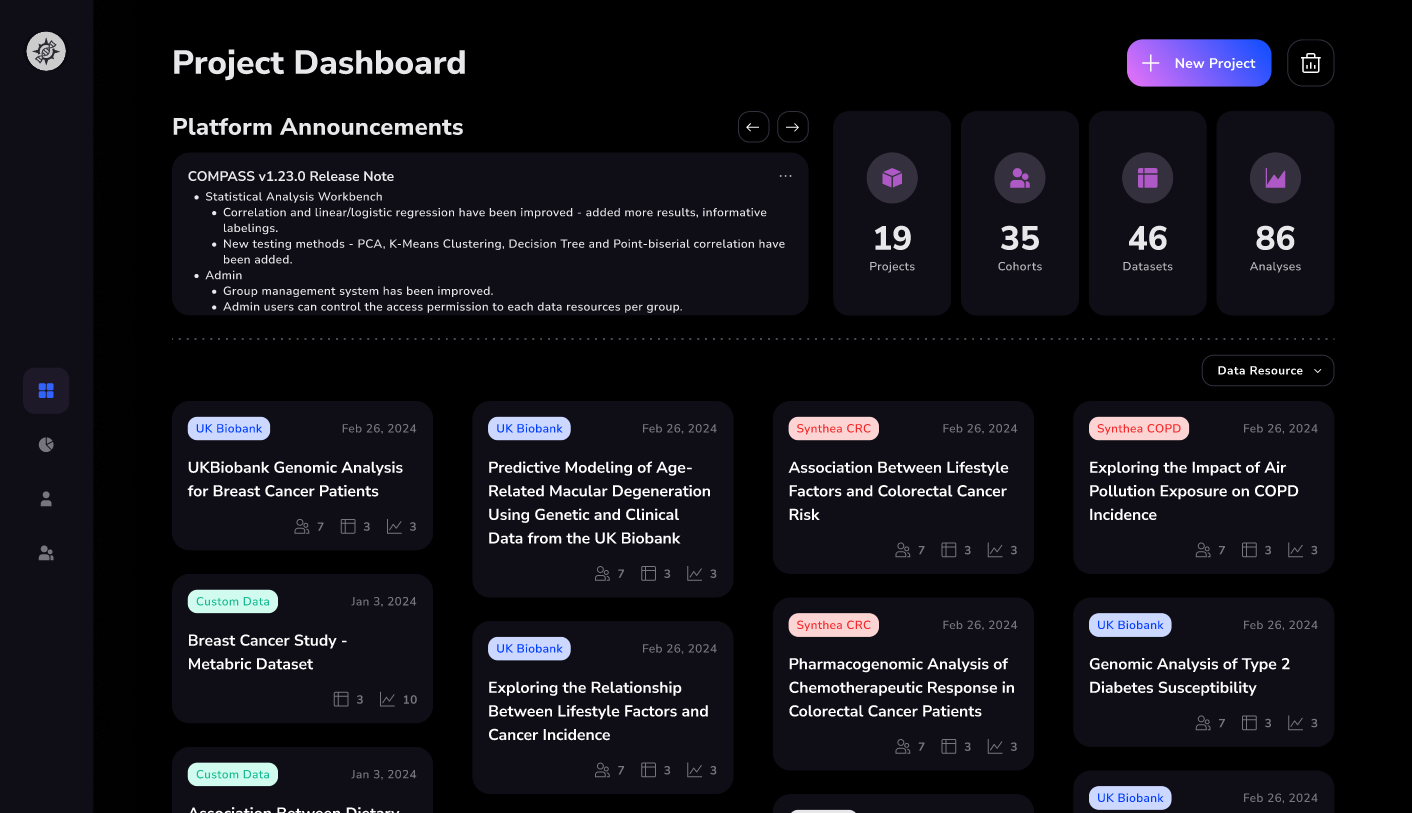
COMPASS takes a study from data access to results without code: build the cohort, extract the variables, run the analysis and export the report. If you want to write your own data step, custom Python is there too.

Your data, as it is
Connect OMOP CDM 5.3 and 5.4 databases, large biobanks including genotype, exome and genome data, VCF and PLINK genotype files, or upload your own CSV and TSV files.

Federated analysis across institutions
Run one study across several institutions without moving patient records. Each site computes on its own data and returns only aggregate results, after applying its own minimum-count floors. The results match a pooled analysis of all sites.

Statistics and machine learning without code
From Table 1 and regression to survival analysis, GWAS and AutoML, every method runs from the interface and gives you figures and tables ready for a paper. Teams sign in with single sign-on and share projects, and federated studies run inside a secure remote workspace.
What you can do with
COMPASS
Federated Analysis
Run cohorts and statistics across institutions. Each site computes on its own records and returns only aggregate results.
Cohort Builder
Define cohorts from diagnoses, prescriptions, procedures, measurements and genotype status, with time windows and a participant flow diagram.

Dataset Builder
Extract clinical and genomic variables, add comorbidity indices and clinical scores, clean data point and click, and match on propensity scores.
Statistical Analysis
Table 1, regression, group comparisons, ANOVA and survival analysis, with reports you can export to Word, LaTeX or PDF.
Genetics
GWAS with quality control, polygenic risk scores and pharmacogenomic metabolizer status, on large biobanks or your own genotype files.
Machine Learning
Train and compare prediction models, or let AutoML rank them, with SHAP explanations, ROC curves and calibration plots.
From question to results in three steps
Bring your study design
Start from the question you already have: who is in the study, what happened to them and when. COMPASS turns those choices into queries on your data, so you don't need to know the database structure or write scripts.

Build the cohort
Pick inclusion and exclusion criteria from diagnoses, prescriptions, procedures, measurements and genotype status, set index dates and time windows, and see who drops out at each step in a participant flow diagram you can export.

Analyze and export
Choose a method, pick the variables and read the results in plots and tables, with a report for many methods. Export tables and figures to Word, LaTeX, PDF or PNG.

Book a demo: see how COMPASS works
We'll walk you through the key parts of COMPASS on a study like yours.
How does it compare to your workflow?
Real-world use cases
How research teams use COMPASS, from single-hospital outcome studies to biobank genomics and studies across institutions.

Multi-site studies
Run one cohort and one analysis across institutions with federated analysis. Patient-level records stay with each data holder.
Hospital outcomes research
Build a cohort from your hospital's OMOP data, describe it in a Table 1, and test outcomes with regression and survival analysis.
Pharmacogenomics
Derive CYP2C19 and other metabolizer phenotypes from genotypes, add scores such as ABCD-GENE, and relate them to drug response.
Biobank genomics
Run GWAS with quality control and build polygenic risk scores on large biobanks, including their genotype, exome and genome data.
Teaching and training
Give students hands-on practice with real health data formats, statistical tests and model training, without a programming course first.
Check out our latest activities
We work with research organizations, teach students, present at conferences and publish our own research using COMPASS.
Publications
Beyond psychiatric diagnosis: detection-gap perspective on suicide decedents in a population-based cohort
ABCD-GENE Score and Bleeding in Post-PCI Patients: Implications for Guided De-Escalation of Antiplatelet Therapy
Long-term outcome in children with infantile epileptic spasms syndrome: a multicenter retrospective study in Korea
UK Biobank-Based Genetic and Proteomic Network Insights into Metabolic Dysfunction-Associated Steatotic Liver Disease Pathogenesis
Population-Scale Plasma Proteomic Profiles Associated with Chronic Periodontitis in the UK Biobank
Pharmacogenomic Testing for CYP2C19 Variants among Stroke Patients Treated with Clopidogrel: Opportunity for the Clinical Laboratory?
News
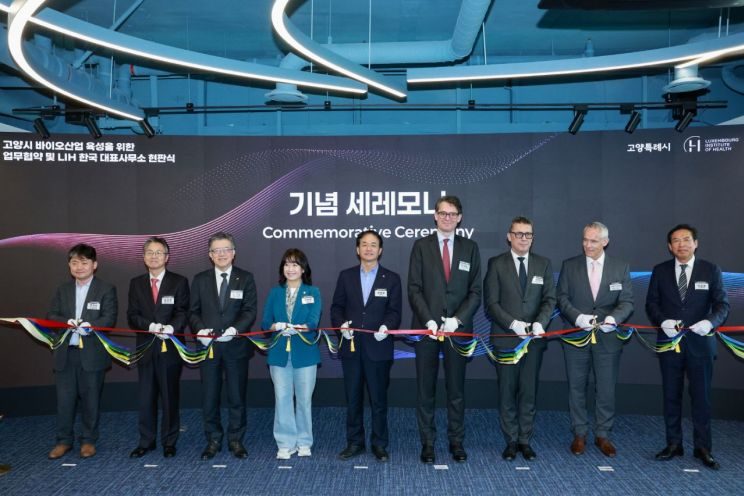
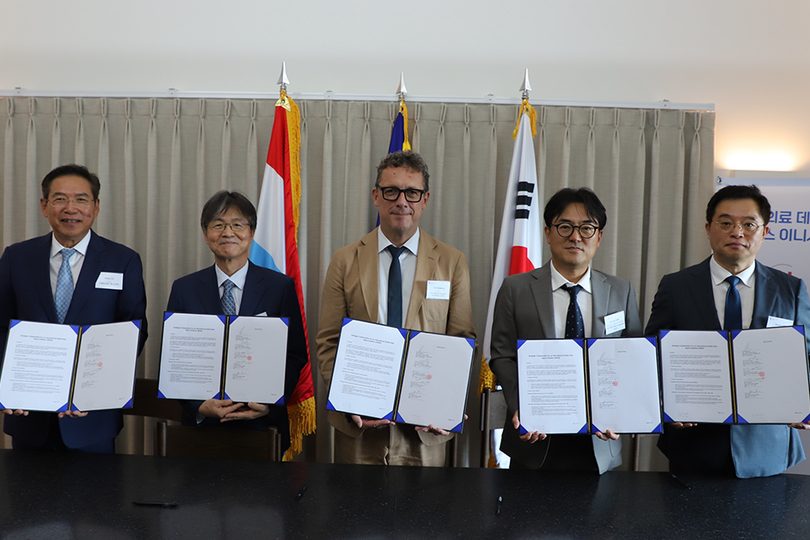
International Health Data Space Initiative (IHDSI) launches with Cipherome as a technology partner


FAQs

Yes. Every step, from the cohort to the final report, runs from the interface with guidance along the way. If you do want to write code, you can add your own Python step to a dataset.
No. COMPASS lets you do much of the core analysis yourself. Once you have results, you can work with your statistician on the questions that need more advanced methods.
Yes. Plots and tables export to Word, LaTeX, PDF and PNG, and many methods come with a report that explains the results. We use the same exports for our own papers.
Tell us what you need. COMPASS is built so new methods can be added, and recent additions include AutoML, propensity score matching and federated analysis.
Use federated analysis. Each institution runs the analysis on its own records and returns only aggregate results, after applying its own minimum-count floors, so patient-level records stay with each data holder.
OMOP CDM 5.3 and 5.4 databases, large biobanks including genotype, exome and genome data, VCF and PLINK genotype files, and CSV or TSV files you upload.
Both. COMPASS was born from our own pharmacogenomic research on UK Biobank data, where we spent more time on scripts and dependencies than on the research. We built workflows that let us focus on the questions, and we now offer them to other researchers.